TL;DR: I don't know what to do and think most people don't, too.
I mean, private emissions, I heard, are insignificant compared to industrial. But then, industry exists because, in the end, we consume stuff. Right?
I'm sincerely hoping for someone who I can trust to explain to me how I'm making the world a worse place by purchasing, let's say, a car, and that as if I'm a 5-year-old. Not because I'm easily bored, but because (I accept,) I'm still ignorant and I need to start from the beginning.
A meteorologist (I just googled "scientist who studies weather", not a native speaker here) telling me "hey, the temperatures will increase by X degrees and the sea level will increase by X meters so... we are doomed" makes me want to do something but I can't even begin to predict the effects.
Also there are these false data generated by (IMHO, crazy) deniers but while easy to catch on its own, they have this side effect of creating many false positives while trying to identify fake data in this ocean called the internet.
TL;DR: better energy production/transportation methods, data-driven tools for finding bottle necks in production systems, information distribution for infrastructure and coordination and energy demand, making better tools to collect, analyze, present, and change minds.
Basically the same talent and sweat we put into getting 1% more click through rate to put on the slide deck for the next VC funding pitch, except, you know, put towards not having our grandkids die. You know, that kind of stuff.
"If any 'founders' out there want to 'disrupt' our 401 ppm atmospheric CO2, or 'moonshot' ocean acidification, that would be cool"
OK, I started reading this and came back shortly to say it's amazing. I will probably read it more than once and keep it as a reference. OTOH, maybe it doesn't say too much about the impact of the mentioned actions, I'll just have to read, I guess.
One person on their own can only do so much, so on a personal level "buy as little as you can while staying happy" (or "save as much as you can and retire early") are good things. These are good for individuals even if we are wrong about climate change.
Cars, for example: When you buy a car, the car maker realises there is demand for cars and makes more cars. If you buy cars less often, they makes less of them, putting less CO2 into the air.
Your English is good, by the way. While "meteorologist" is a scientist who studies weather, and "climatologist" is a scientist who studies the climate, even many native speakers get "weather" and "climate" mixed up.
I'm sincerely hoping for someone who I can trust to explain to me how I'm making the world a worse place by purchasing, let's say, a car, and that as if I'm a 5-year-old.
I don't follow global warming goes, but I believe the argument goes: the more CO2 there is in the atmosphere, the more people will die, and the more we consume, the more CO2 will be in the atmosphere...
Private emissions are definitely significant, and it's important that people know this. Food, heating/cooling and transportation are the big household ones. And they're straightforward to make improvements in.
Let me be more clear: What would be the impact of 1 million people switching to using bikes from cars to go to work for a year, in terms of, hmm, well-being of polar bears (animals for which I care deeply, like other animals)?
Everyone is telling me to do this and that, and that it's important. No one seems to be talking about the impact.
Being a software-developer, I know there is a limit to how much you can dumb-down the things. I probably wouldn't be able to explain two's complement to a five-year-old. But, I see the importance of the issue and we need to begin somewhere.
But how much? For example, what would be the impact of a 20% reduction in traffic congestion, made possible say by workplaces moving to a 20% remote workforce (or every employee works from home one day per week on average). What if we were to reduce our flights by 10% or 20%? These are things that people can actually envision doing. How much is needed in order to actually help? Maybe only a 5% reduction is needed (one day home in 20)?
> and the one most people are least willing to cut down on.
Getting people to eat less meat or meat from less worse emitters or upgrading existing buildings to low emissions for heating does not seem that much easier.
Anyway, you can't fix the problem with a single change.
People are set in their ways, but there's a continuous rollover of generations. Current young adults are much less into cars, air travel and meat. (Older people do make these changes too, but it's slower).
Changing my own behavior won't do anything noticeable. Several billion people need to change their behavior. That's why people want governments to get involved.
Of course you can't save the planet alone. However, researchers did the math and found every ton of CO2 eliminates 3m² of Arctic sea ice. Multiply this with average sea ice thickness (>1m) and start to take care of your personal block of sea ice.
My point is that this is the message that needs to be said. If everyone would try to drive 2000 fewer miles this year, we can make a real difference. Or can we? Or maybe it's only 200 miles per person?
Maximising my MPG rating was a sport for me, until partner crashed the car. I managed 75 MPG (UK gallons) reliably. I sold the replacement car as soon as I could once she moved to California, went back to just cycling (I live in the UK).
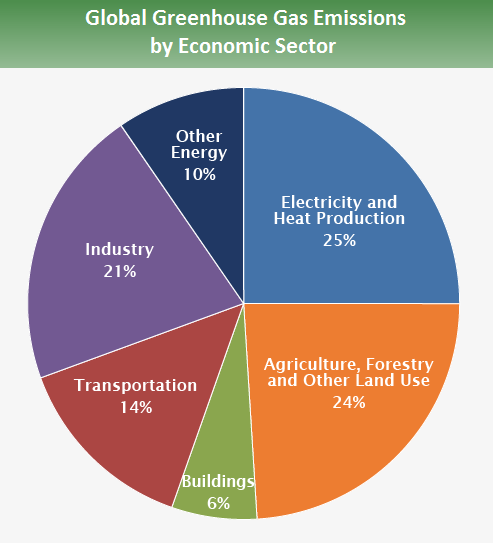
Looking at the makeup of CO2 emissions [1] (ignoring methane and other factors) it seems that it makes the most sense to avoid unneccessary heating and electricity consumption (which most people will already do because it's good for your wallet) and cut back on driving (which most people don't). For agriculture and industry, the two big other factors, you're probably right: There's not much a single person can do.
Agriculture and industry are just producers to your consumption. They produce the meat/dairy and electricity you use. So there is definitely a lot consumers can do by personal choices. But of course regulation is needed too.
Well, yes and no. This issue suffers from the tragedy of the commons. If I reduce my emissions significantly it will have zero impact if I'm the only one doing it. The only thing it does is help me feel better about myself and lowers my standard of living. The only way to realistically solve this is collective action and that's what the government is for. I actually think that we also have been to gentle about this topic on general. I'm in favor of sanctions against countries who refuse to lower emissions.
Wishing doesn't help. Changing my thoughts and actions doesn't change other people's thoughts and actions. Sure, it's bad if everyone thinks this way, but I can't fix that.
This is a standard collective action problem. Haranguing people who point that out doesn't solve the problem.
I am in the middle of a year (to start) without flying. Most people when I ask the last time they went 365 without flying say decades. That was the case for me. I'm learning that flying and happiness have zero correlation.
Haven't eaten meat since 1999, and maybe a few pounds of animal products in the past decade.
Haven't owned a car since 1988.
I live in Manhattan and take maybe 2 or 3 taxi rides a year. I'm even taking the subway and bus less in favor of walking.
Avoid food with packaging, mostly buying from farmers markets and a CSA, to where I empty my landfill garbage 3 or 4 times per year.
Developing relations with people at Columbia's earth science departments to see about developing leadership courses there to help the people most knowledgeable about the science to become more influential.
Personally, I've accepted our apocalyptic doom, and decided to increase my carbon footprint as much as possible. Some people just want to watch the world burn. Literally.
For the period 1989–2014 this observation is interesting.
"We have analysed observations of the summer sea ice edge from the ship logbooks of explorers such as Robert Falcon Scott, Ernest Shackleton and their contemporaries during the Heroic Age of Antarctic Exploration (1897–1917), and in this study we compare these to satellite observations from the period 1989–2014, offering insight into the ice conditions of this period, from direct observations, for the first time. This comparison shows that the summer sea ice edge was between 1.0 and 1.7° further north in the Weddell Sea during this period but that ice conditions were surprisingly comparable to the present day in other sectors."
Global warming is a natural consequence of capitalism.
Any system which rewards short-sightedness over long-sightedness is going to create long term problems.
Until we have a single world government, no single country is going to be willing to spend money protecting the environment while other countries keep profiting from its pollution.
It's not even short-sightedness, it's failing to internalise externalities[0]. And of course the current profiteers will do everything they can to keep things as they are, see e.g. the fate of carbon taxes whose entire purpose is to try and internalise some of the externalities into capitalistic frameworks.
> trending toward recovering back to within 2 sigma?
I wouldn't bet on that. The graphs only show area. The shortened time the arctic ice has to grow means it will be thinner than previously and thus melt more rapidly during spring, again driving it away from the historical mean.
And yet, this chart is a quintessential story of data representation manipulation, worthy of being included in textbooks (if there are any on this topic).
1) Lines for years with low ice area are marked bold, when high-ice years (e.g. 2013 or 2015) are shown with thin lines.
2) Color scheme is deliberately confusing, with some colors are almost identical (1993 vs 2015, anyone?)
3) The data set is started with 1978, one of the colder years. If it would have been 1979 or 1974, the story would have been less immediately visible.
While I am not saying there isn't a trend, and 2016 is clearly an anomalous year (but what about this year _was_ normal?), visible manipulations like these quickly destroy any remaining trust in climate science, advancing the other side's cause.
I'm not sure where all the aggression and distrust comes from, but if you had done a a simple search, you would easily see that your points are false.
1) a) Every single line shown are thin lines except for the 6 lowest average-ice years, which is clearly marked in the legend (2006-7, 11-12, 16-17). That makes for 34 thin lines and 6 thick lines.
b) Also, why would that visual distinction be misleading again? All it would emphasize are when the low-ice time periods are - in the recent decades. It's not like there was a low-ice period in 1979 or something that the author intentionally made thin.
2) It is not visually possible to pick 40 colors that are distinct enough in color space that you can consistently tell at a glance (i.e. when you look away and only compare the next color from memory). Go ahead and try it. Visual perception researchers have tried (http://vis.stanford.edu/color-names/) and the best you're going to get is maybe 12 (http://colorbrewer2.org/)
3) This is so wrong, it's not even wrong:
a) the data only existed starting in 1978, because the Nimbus 7 launched in 1978, so this is the whole available data (http://psc.apl.washington.edu/zhang/Global_seaice/).
b) Global sea ice isn't in perfect lockstep with temperature, but larger temperature trends and currents and other factors, so talking about a handful of warmer or colder years doesn't even make sense.
c) Even if it were, I still don't know what you're talking about. See the NASA land-ocean temperature index (http://climate.nasa.gov/vital-signs/global-temperature/). You could have started in 1977, or 76, or 75... you'd have to go all the way back to 1945 to find a warmer year, and that would be missing the whole point of the overwhelming trend.
I'd be very careful to make sure that I'm not the one doing the public a disservice when I openly accuse people of manipulating data. I wish everyone showed a similar courtesy.
They show 28 overlapping lines, that many lines simply can't be individually coloured. To accuse them of deliberately choosing a poor colour scheme is plain dishonest.
It is a graph comparing the current year to the previous minimum area years, with the entire dataset for context. The choices they have made are completely legitimate for this purpose.
Fact of the matter is, the GP is right. Can we at least agree the color scheme could have been chosen better ?
You are also obviously showing a bias towards one conclusion, and accusing opposition to this conclusion of being "plain dishonest" is not constructive. This is data interpretation. Even attributing 100% to your prior (ie. ignoring the data) is not considered dishonest.
Furthermore, when push comes to shove, let me just say that as someone holding a masters in statistics, there is zero useful data on that chart. I think the the point is to show that we are more than 2 standard deviations from the norm ... And then we have a long list of issues with that conslusion. In increasing importance :
1) there is an obvious reason to pick the start of the time series, and that reason is NOT independent of the conclusion that is reached here. Needless to say, that is a huge no-no.
2) more generally the data supporting the conclusion is not randomly drawn from the distribution. Again, huge no-no.
3) is the relation between time of year and sea ice extent well established ? For instance, does the minimum drift ? How much ? (Why I pick that one: because if you ignore the time of year, flatten the data, we are suddenly very far removed from a 2 sigma deviation, and arrive at a much more sane conclusion : lowest extent ever, but not hugely different from before. And of course, seeing 2 extremes of a slowly evolving variable close together is not exactly strange. When you're climbing the hill, every step sets a "new height record". Focusing on that is misleading, to say the least).
How often do we hit "lowest ever" because the minimum extent falls at a slightly different point every year ? (looking at the data: quite often, for instance, we hit lowest ever and highest ever extents last year. Lines that hit "lowest ever" at some point: dark red, dirty green, thick bright green, thin dark green, thin light green, purple, orange and another medium-dark green. I can't be bothered to look up the years, but I think the point stands: lowest ever is not a rare occurrence, and therefore "more than 2 sigma below the norm" is not an accurate way to report that).
You are making assumptions just by choosing which 2 variables to graph against eachother. Are these assumptions valid ? Why ? If you don't have a reason, then please, shut up until you've done your homework.
It may make a lot more sense to plot the minima at the same points every year, to prevent normal noise from generating these extremes, or just only compare minima and maxima, and even then, smoothing out over 4-5 years seems necessary. Or perhaps just don't report things like this.
3) more fundamentally, why would the data be normally distributed at all ? This seems to me unlikely in the extreme.
Technically speaking, the data is contradictory: it leads to a conclusion that disproves itself. The steps work like this : if the sea ice extent is indeed dropping over time (the conclusion of the graph), then obviously it's distribution over time cannot be normally distributed. Unfortunately that is a necessary precondition for interpreting the data in the first place. If the data is not normally distributed, then there is nothing strange about a 2 sigma deviation, which at that point is nothing but an arbitrary numerical value that has nothing to do with the distribution.
If you want to prove that the data is indeed less than the data of the previous years, there's tests for that. This is not it.
4) that grey band obviously covers 98% of the data in the way years are reported here. Years are reported as special, when the 2-sigma deviation is based on days. The time series regularly dive outside of that band, and it's easy to see why: over (2016-1978)*365 days, we should expect ~2% 2-sigma events (days). That's a LOT of days.
5) we should keep our heads screwed on and ask ourselves if the data is really showing what we think it's showing. I would argue no. It looks to me like something prevented sea ice from reforming between August and December of last year. It seems to me unlikely in the extreme that such a sudden and big change would result from the minute temperature change that global warming contributed this year. Maybe not entirely out of the question, but that's an extraordinary claim, requiring extraordinary evidence. And frankly, this article is not off to a good start.
Or to put it more technically : it looks 2016 is drawn from a different distribution than the other years. That means you should find out what happened using other means, and stop using statistics. It cannot help you in this case.
Conclusion: there is something weird happening, true, but based on intuition alone. And let's be honest : chances are very good it's not global warming. Something changed, and it was not a 0.2 degree temperature change. This is way too big for that to be a valid explanation.
> And that launch was done because of the problem to be analysed. Feedback loop closed.
Oh, yes, the Planck satellite was launched because of the problem to be analysed. Feedback loop closed.
Meteo satellites were launched because of the problem to be analysed. Feedback loop closed.
GPS satellites were launched because of the problem to be analysed. Feedback loop closed.
Are you aware that you have arrived to a cnoclusion and you're trying very hard to bent reality to adapt to your conclusion even when your arguments are absurd?
Look you're attacking the weakest of the points. I think you're being unfair in your comparison.
But pedantically the point stands. The planck satellite studies a phenomenon that exists independently of the satellite or the humans studying it. This satellite was launched to study climate change by people who claim they're causing it. There's a clear difference.
> And exaclty why the results are disatrously?
Because using data about something you're doing yourself to study that phenomenon invalidates the basic axioms of statistics. If you do that, all your conclusions about the data become wrong. Why ? Because you yourself are now a factor in the phenomenon under study. At that point, and I've seen this many times, there is no longer any real hope of being correct, as there either a big gaping hole in the model, or circular reasoning. Both obviously invalidate the model.
The satellites where launched to study the ices and is independent of who or what makes them change. As I said, you clearly have a conclusion beforehand and even if facts kickball you will deny it like you're doing.
You don't have provided any rational argument for you criticism, when you were proved wrong anon when the time series started, you changed the goalposts.
As I'm very tired of deniers like you, have a nice day.
Enjoy your feedback-based data. We'll see how correct it is.
Funny how your criticism of me consists of 2 things :
1) I have a predetermined conclusion
2) and it's the wrong one (obviously you have a predetermined conclusion as well and it doesn't seem to tolerate people of different opinions)
My big argument is this : why don't we look at the main point ? Obviously that last year of data doesn't fit the data series. Obviously it's an outlier (just freaking look at it). That means it should be treated as an outlier : don't base conclusions on it, and figure out what has changed.
And it's an outlier so let me tell you: the effect seen here is NOT (directly) related to a very slow change that started in 1850. It is something else.
This also means, don't use statistics to analyse it. It won't work.
Could you please explain how the satellite observing the arctic sea ice affects climate change? As far as I can tell, until this past year (the paris climate agreement) that hasn't been a significant effort to reduce carbon emissions on a global scale, which almost certainly wouldn't have an appreciable affect on the extent/surface area of arctic sea ice (carbon cycles through the atmosphere very slowly (the fastest processes take about a year and the slowest take millions of years[0]) so it will take a while before the affects of human intervention actually propagate to the scale of global climate).
Also, you can certainly study outliers with statistics. In fact, most scientific discoveries (these days) all start out as outliers or statistical anomalies. The Higgs boson, Top quark, J/Psi,... every single particle described by the Standard Model (the most accurate scientific theory by far) all started out as anomalies and outliers. The fact that this years sea ice measurements are outliers doesn't mean they are necessarily a large statistical fluctuation, it could be that there is a new climate phenomenon taking place (look up the runaway greenhouse effect). I'm not saying that is what is happening here but we have no idea a priori which is the truth at the moment: it's a statistical fluctuation or it's a sign of a new climate phenomenon. Clearly all we can do is continue to study it using, among other tools, statistics.
0.2 degrees is the global average temperature change over the last year. What matters to the arctic is the temperature in the arctic, which has gone up a lot more than that.
More importantly, the graph shows area. It doesn't show thickness, which has been steadily decreasing for decades. Now the ice is quite thin, so it doesn't have to thin much more for the area to drop rapidly.
If you want to read about the physical processes in detail, and find out why a large sudden drop in ice area due to global warming isn't surprising at all, read A Farewell to Ice by arctic researcher Peter Wadham.
I suppose points 2) and 3) can (but unlikely to -- see below) be unintentional, but point 1) is clearly intentional and sufficient to consider this chart manipulative.
As for the color scheme choice -- almost any other option would have been better. If the colors were random, it would have removed the ability to recover the trend in any way except of tedious manual comparison, but at least it would be certainly bias-free. If mapped to some color gradient -- well, fitting 28 points is hard, but at least close colors would have matched close years. But this scheme is different. It _looks_ like the gradient map, and invites the reader to mentally build the year-to-year trend, but some colors are nearly repeated in distant areas! This is a cardinal sin of using color mapping for dimensional representation, and it's hard for me to imagine this could be done unintentionally.
Not to mention that this is not a good choice for representing YTY trend; 2D color map, like in https://xkcd.com/1410/, would be so much better.
If someone talks about "remaining trust in climate science" is because he doesn't believe any data and looks for any miningless thing to try to not believe it like your comments about the graph
And it took just 30 seconds of search to know why the data starts in 1978[0]:
> Useful satellite data concerning sea ice began in late 1978 with the launch of NASA's Scanning Multichannel Microwave Radiometer (SMMR) satellite.
Everyone seems to want to wait for government regulation or something to change other people's behavior. Governments will follow what voters do.